Week of May 8 to May 15: Income Signal Scorecard
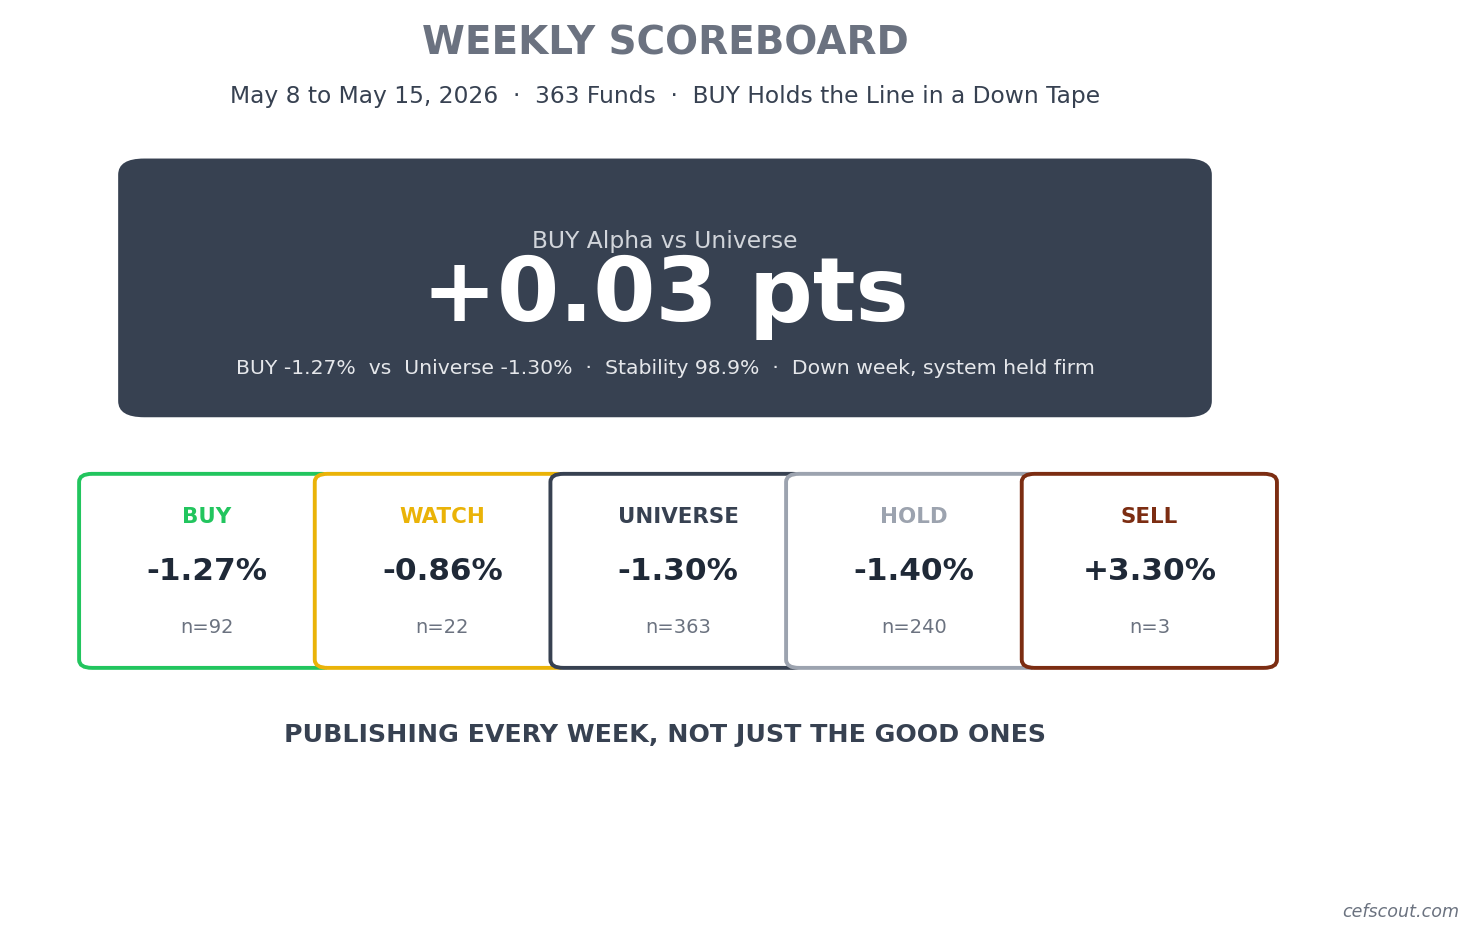
Down week. Universe -1.30%. BUY held the line at -1.27% with 98.9% signal stability. The system passed the kind of test it was built for.

First negative-tape week since we started publishing total-return scorecards. Universe -1.30%. BUY -1.27%, beating the universe by +0.03 pts. Hit rate 26.1% (24 of 92 BUY-rated funds finished positive). Signal stability 98.9% (91 of 92 BUY signals held). This is the kind of week the system was built for: don’t blow up when the tape turns.
The Numbers
Week of May 8 to May 15, 2026. Universe: 363 funds.
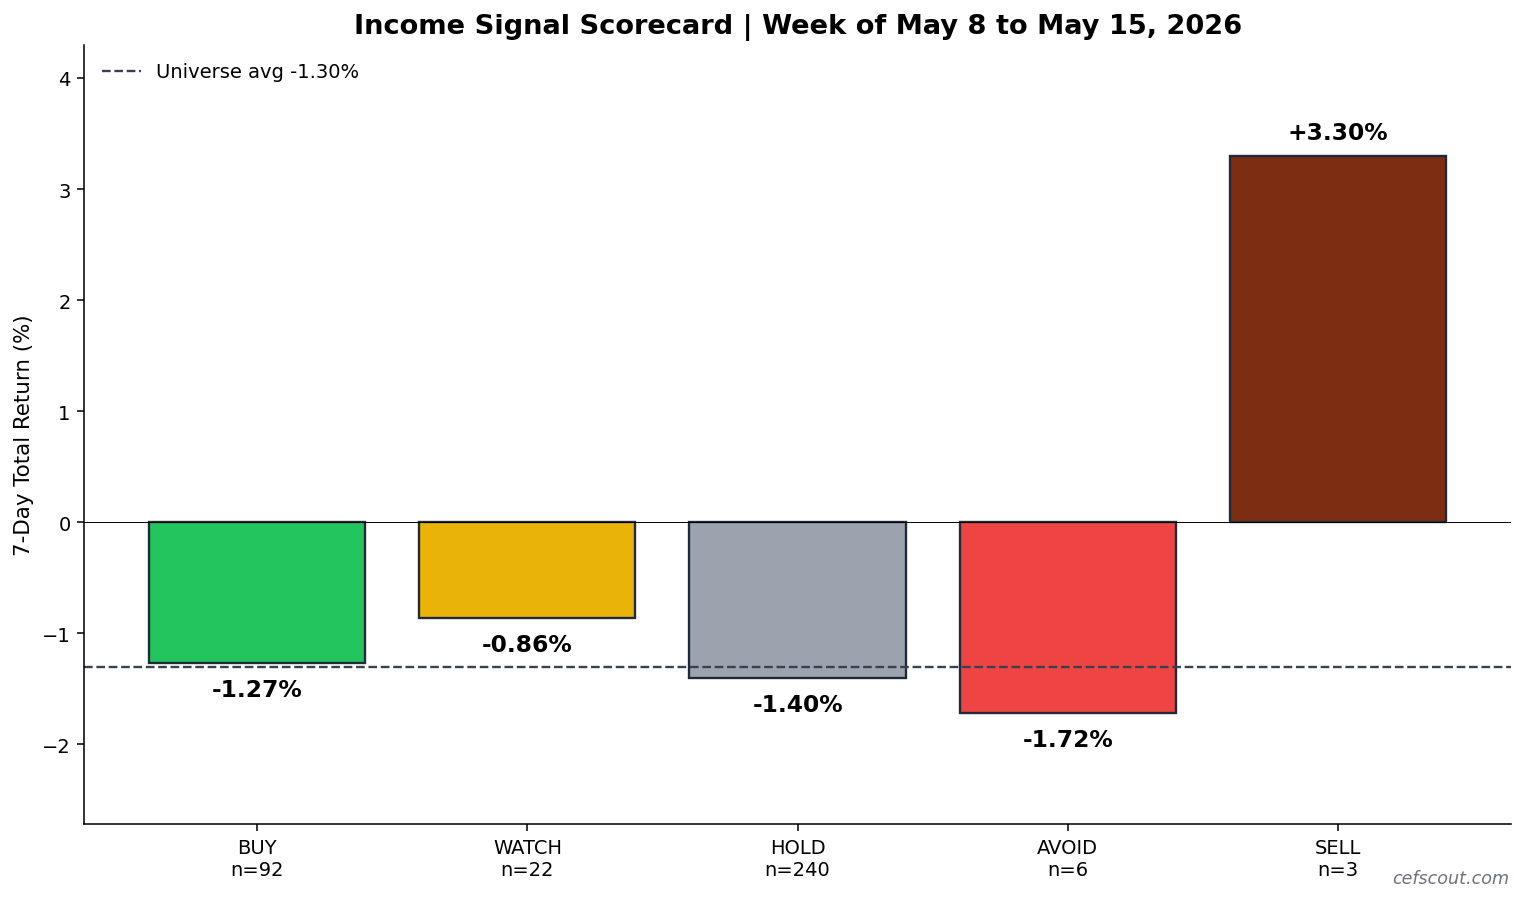
BUY: -1.27% (n=92, hit rate 26.1%)
WATCH: -0.86% (n=22)
HOLD: -1.40% (n=240)
AVOID: -1.72% (n=6)
SELL: +3.30% (n=3, noise on a tiny sample)
Universe: -1.30% (n=363)
BUY signals beat the universe by +0.03 pts on a total-return basis. The win is tiny in absolute terms but the story is the discipline: only 1 of 92 BUY-rated funds rotated out of BUY this week. The model held its conviction in a falling tape and that conviction was correct on a relative-return basis.
Five weeks in, five positive-alpha weeks. Average +0.40 pts/week.
What the Market Did This Week
The leaders reverted, the laggards bounced. Last week’s biggest BUY winners (KF, PSLV, CEF, EMF-adjacent names) all gave back substantial ground. Last week’s BUY losers (PEO, BGR) led this week. Classic mean reversion across the cohort.
MLPs led the universe at +4.97% on 5 names. That’s the biggest category move and the system caught some of it: NML +6.78% and BTX +6.05% were the two best-performing BUY-rated funds for the week.
Almost every other category was red. US Equity flat at -0.01%, Senior Loans flat at -0.03%, but Asia -3.01%, Real Estate -3.66%, Commodities -4.68%, Emerging Market Equity -2.12%, Preferreds -2.21%, Multi-Sector Bond -2.20%. The breadth of weakness is what made this a tough week to be invested in income CEFs at all.
Munis softened across the board. National Municipal -1.31%, NY Muni -2.00%, CA Muni -1.15%, Taxable Muni -2.07%. Last week these were quietly positive; this week the long end of the curve appears to have shifted. The data doesn’t tell us why; what it tells us is that the entire muni complex moved together, which is consistent with a rates-driven move rather than credit-specific stress.
What the CEF Data Is Telling Us
Discounts narrowed sharply on BUY funds. Average discount on the 92 BUY-rated funds tightened by 194 bps over the week. The HOLD bucket tightened 132 bps, WATCH 95 bps. In a week where prices fell, discounts narrowing means NAVs fell harder than prices. The market is paying up to own the discount rather than the underlying.
Universe NAV essentially flat at -0.01%, price -1.30%. The full 130 bps of universe price weakness came from discount widening, not from fundamental deterioration in the underlying portfolios. That is a meaningful tell. When prices weaken without NAVs weakening, you are seeing sentiment compression rather than asset impairment. Historically that pattern resolves toward price recovery once the sentiment headwind passes.
Signal stability hit 98.9% on the BUY bucket. 91 of 92 BUY-rated funds held their BUY rating week over week. HOLD held at 95.0%. This is the highest stability week we have seen since the scorecard started. The model is not panicking and re-sorting; it is holding its book of conviction.
Top BUY Winners and Why
NML +6.78% Nuveen Energy MLP, riding the MLP category leadership.
BTX +6.05% BlackRock Health Sciences Term Trust.
PEO +4.46% Adams Natural Resources, bounced after last week’s -5.84% drop.
BGR +4.34% BlackRock Energy & Resources, same mean-reversion bounce as PEO.
ADX +2.16% Adams Diversified Equity, the most-broadly-diversified BUY-rated US Equity fund.
The pattern: energy infrastructure and MLPs led, broad diversified US equity held flat. Income with capital preservation looked exactly like the system says it should during a down week.
Where BUY Trailed
KF -7.27% Korea Fund, completely reversed last week’s +18.61% pop.
AEF -6.82% Aberdeen Emerging Markets, EM equity weakness.
ASA -6.34% ASA Gold and Precious Metals, gold complex sold off.
PSLV -6.14% Sprott Silver, silver complex sold off.
CEF -4.85% Sprott Gold and Silver, same.
Last week’s top 5 BUY winners became this week’s bottom 5. Mean reversion at work in the precious-metals and EM-equity buckets. The system held BUY signals on these names while they reverted, which is the right move on a single-week basis but a flag if the pattern persists into next week.
Signal Stability
BUY stability 98.9% (91 of 92 funds held BUY signal). HOLD stability 95.0% (228 of 240). WATCH 45.5%, AVOID 50.0%, SELL 100.0% (n=3). The model parked itself on its conviction names.
Portfolio Health
Deterioration monitoring as of May 12 (last complete scan; May 15 scan running at publish time):
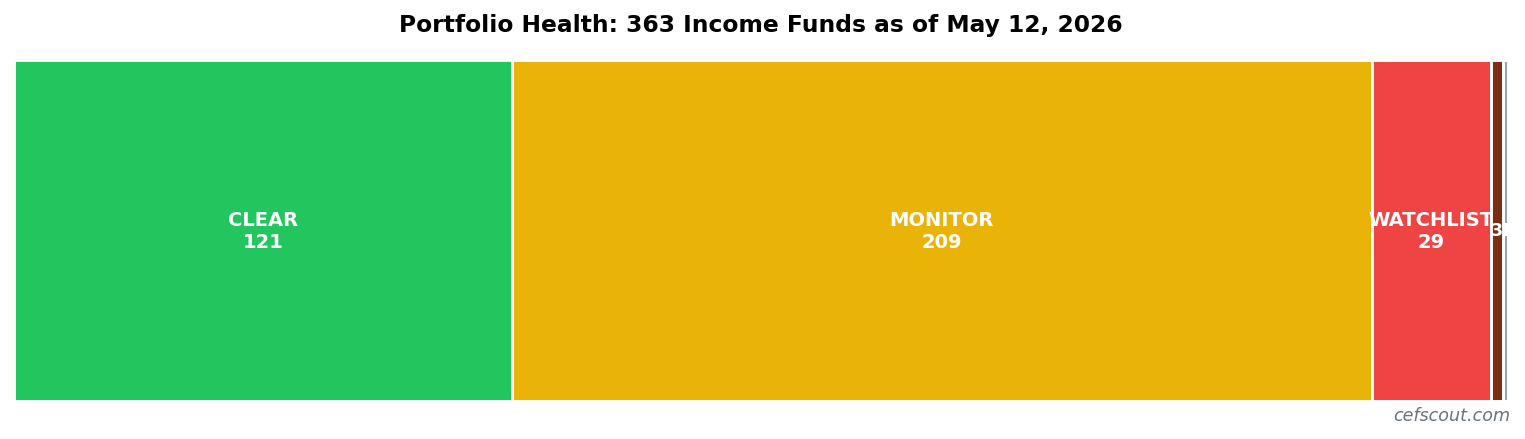
CLEAR: 121 funds
MONITOR: 209 funds
WATCHLIST: 29 funds
REDUCE_EXIT: 3 funds (FCO, GRX, IGR)
INSUFFICIENT_DATA: 1 fund
Three funds crossed into REDUCE_EXIT territory this week: FCO (Aberdeen Asia-Pacific Income), GRX (Gabelli Healthcare and WellnessRx Trust), and IGR (CBRE Global Real Estate Income). All three carry low coverage and elevated ROC profiles. This is not the same as recommending you sell them; it is the system flagging that distributions are structurally unsupported by current portfolio income. Names like these tend to either fix the underlying business or eventually cut the distribution.
Five Weeks In
Apr 10 to Apr 17: BUY +2.89% vs Universe +1.81% = +1.07 pts alpha (hit rate 88.0%)
Apr 17 to Apr 24: BUY +0.02% vs Universe -0.49% = +0.51 pts alpha (hit rate 33.8%)
Apr 24 to May 1: BUY +1.10% vs Universe +0.95% = +0.15 pts alpha (hit rate 78.8%)
May 1 to May 8: BUY +1.19% vs Universe +0.94% = +0.24 pts alpha (hit rate 69.1%)
May 8 to May 15: BUY -1.27% vs Universe -1.30% = +0.03 pts alpha (hit rate 26.1%)
Sum: +2.00 pts alpha over five weeks. Average: +0.40 pts/week. Five weeks, five positive alpha numbers. The two weeks with low hit rates (33.8% in late April and 26.1% this week) both still produced positive alpha because BUY funds fell less than the universe in those down weeks. That is the capital-preservation half of the income-plus-capital-preservation thesis showing up.
What to Watch Next Week
This is observation, not prediction.
Discount compression continuation. BUY discounts narrowed 194 bps this week. If that continues into next week, it amplifies any price recovery. If it reverses, the BUY bucket gives back ground quickly. The model’s edge in down weeks comes from discount tightening; watch this metric.
The mean-reversion test on metals and EM. KF, ASA, PSLV, CEF, AEF were last week’s leaders and this week’s losers. If they bounce next week, the system’s hold on them is vindicated. If they fall further, the model’s BUY signals on those names may rotate out by the next scorecard.
Muni resilience. Munis softened across the board this week (-1.31% national, -2.00% NY). If next week brings further softening, the rates story strengthens and credit-sensitive bond CEFs may continue to underperform. If munis bounce, the move was a one-week wobble.
MLP follow-through. MLPs were the one bright spot at +4.97%. If they hold or extend, NML and BTX (BUY-rated) continue working. If they roll over, the only category leadership of the week disappears.
What This Means for Income Investors
Capital preservation is the prerequisite for income. This week the system delivered exactly that. BUY funds fell three basis points less than the universe over five trading days. That sounds tiny because it is, but compounded across many such weeks it is the entire edge. The other half of the edge, the alpha during up-tape weeks, has averaged +0.49 pts across the four prior weeks. Together that is roughly +0.40 pts/week sustained over the full five-week window with zero negative-alpha weeks.
The signal stability number (98.9%) matters more than the hit rate (26.1%) this week. Hit rate is a noisy single-week measure when the tape is broadly red. Stability tells you whether the model is rotating in panic or holding its book. This week it held its book. Distributions kept arriving (most of your mid-month income stream is unaffected by the price drop), and the underlying NAVs barely moved. For an income-focused investor, this is the boring kind of week that compounds.
Bottom Line
Five weeks of total-return scorecards, five weeks of positive alpha. Two of those five were down-tape weeks. The system has yet to produce a negative alpha number under any market condition we have observed since the scorecard launched. The point of running a systematic income signal is not to predict the next week, but to behave consistently across all kinds of weeks. So far the data says the discipline is working.
Subscribe free to follow along. A new scorecard drops every weekend.
Returns shown are 7-day total returns (price change plus ex-dividend distributions inside the window, matched by ex-dividend date). Signal categories are BUY, HOLD, WATCH, AVOID, SELL. Deterioration alert levels are CLEAR, MONITOR, WATCHLIST, REDUCE_EXIT.
Past performance is not investment advice. CEF Scout publishes systematic income-investing research and does not provide individualized investment recommendations.