Week of May 15 to May 22: Income Signal Scorecard
Recovery week. Universe +0.31%, BUY +0.57% = +0.26 pts alpha. Six weeks in, six positive-alpha weeks. Average +0.38 pts/week.

Six weeks of total-return scorecards, six positive-alpha weeks. This week was a partial recovery from last week’s down tape: the universe finished +0.31% and BUY finished +0.57%, beating by +0.26 pts. Hit rate jumped from 26% last week to 65.3% this week. Signal stability stayed elevated at 95.9%. The model held its book through the down week and harvested the bounce on the way back.
The Numbers
Week of May 15 to May 22, 2026. Universe: 362 funds.
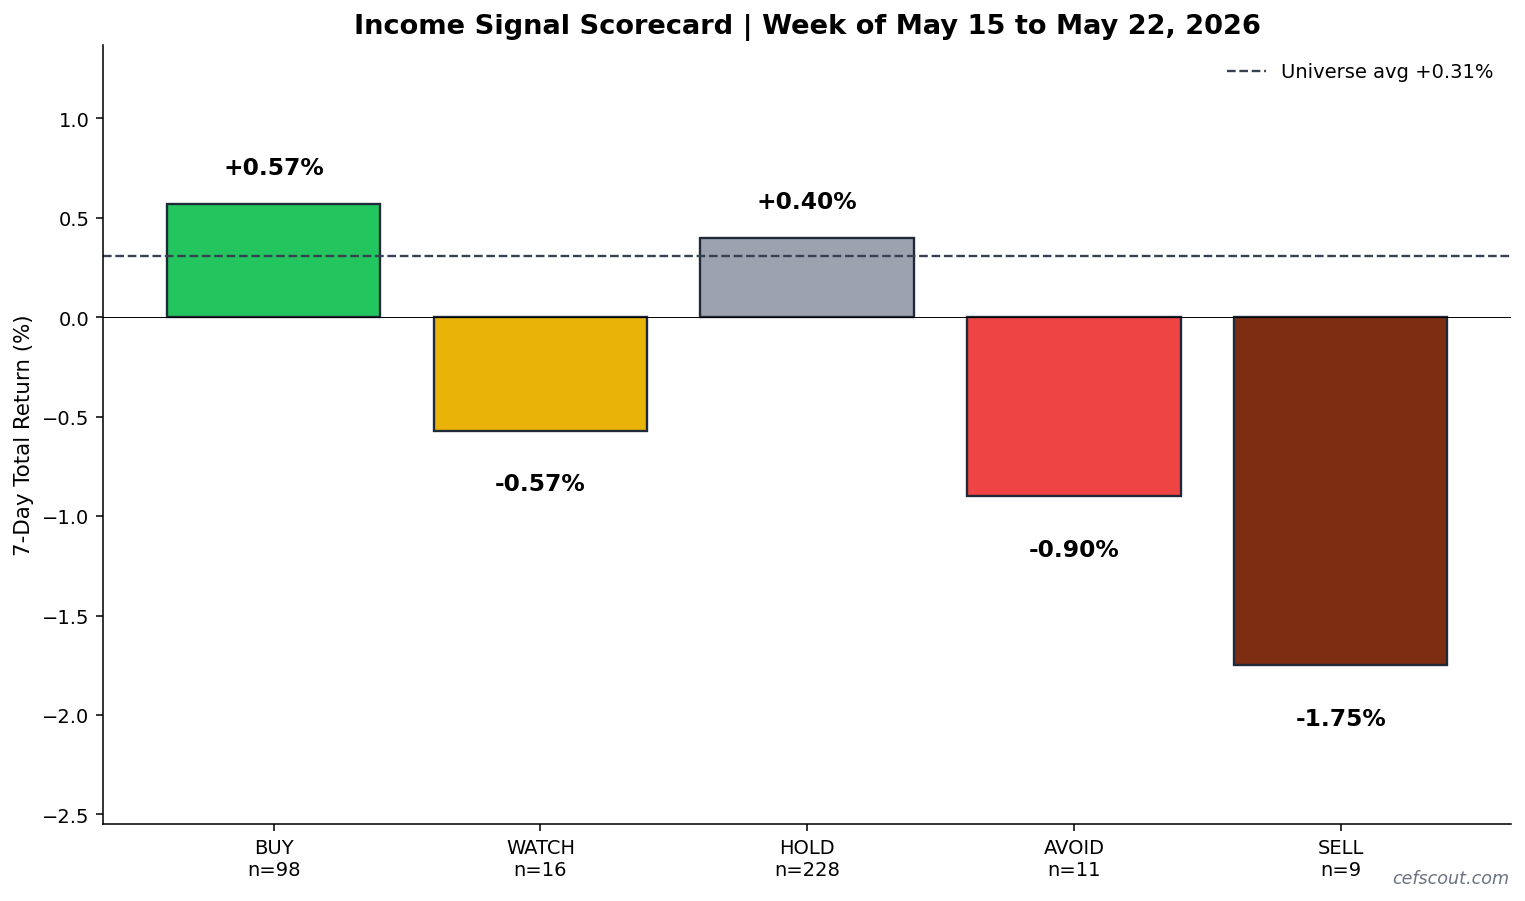
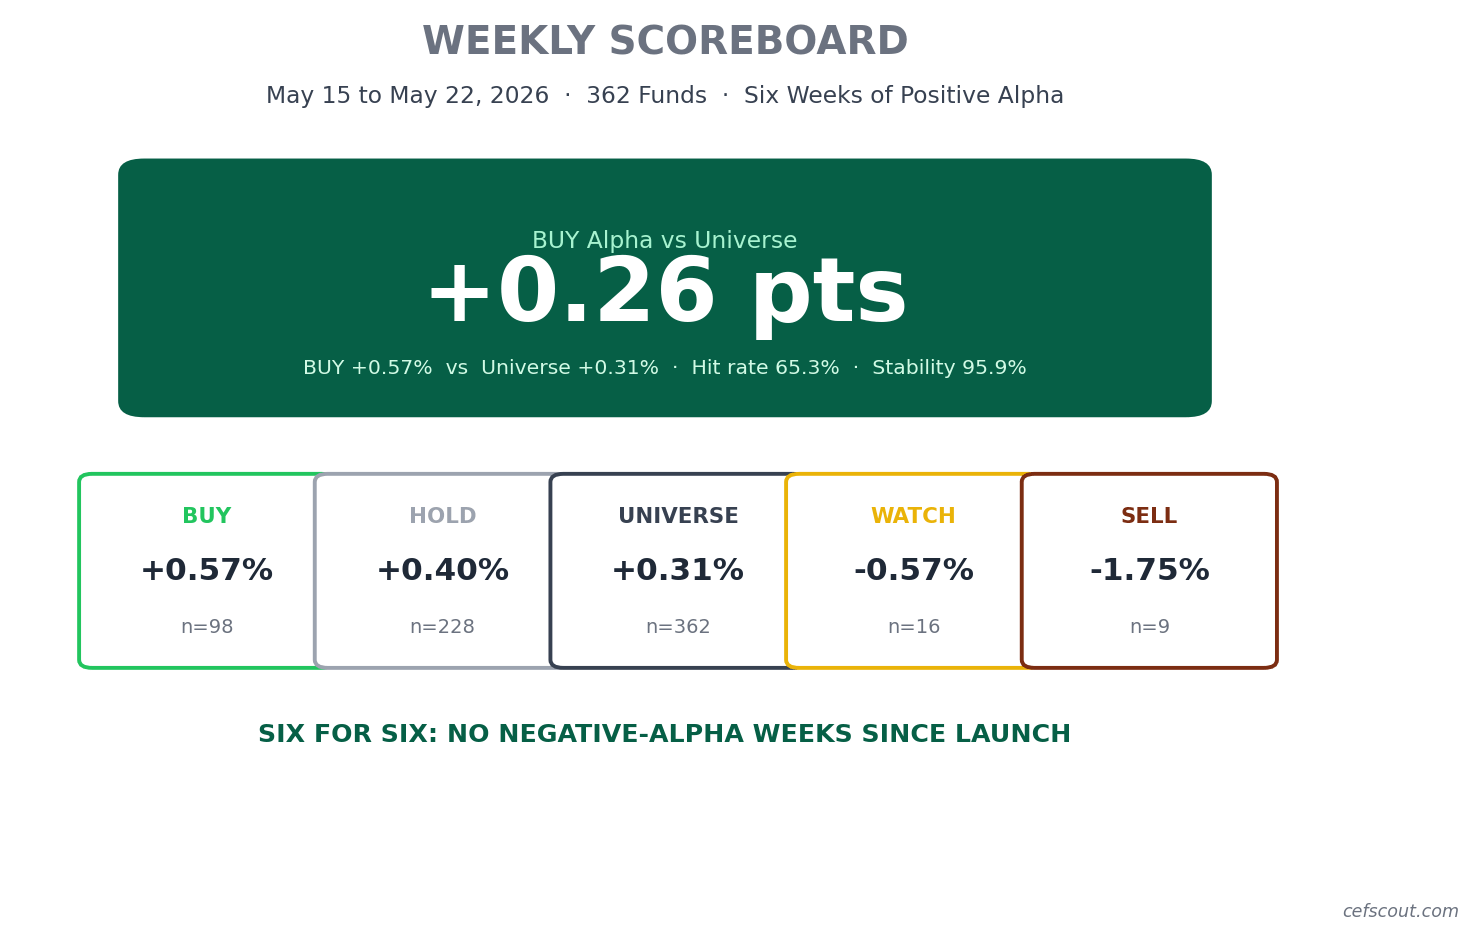
BUY: +0.57% (n=98, hit rate 65.3%)
HOLD: +0.40% (n=228)
WATCH: -0.57% (n=16)
AVOID: -0.90% (n=11)
SELL: -1.75% (n=9)
Universe: +0.31% (n=362)
BUY signals beat the universe by +0.26 pts on a total-return basis. Hit rate 65.3% (64 of 98 BUY-rated funds finished positive). Signal stability 95.9% (94 of 98 BUY signals held week over week).
The defensive buckets did exactly what they are supposed to do. WATCH, AVOID, and SELL all underperformed the universe. SELL at -1.75% on 9 names was the loudest tell: the bottom of the rating ladder behaved like the bottom of the rating ladder.
What the Market Did This Week
Equity-leaning income led. Covered-Call Funds averaged +2.04% on 21 names. Sector Equity averaged +2.02% on 28 names. Convertibles +1.53%, Real Estate +0.96%, US Equity +0.88%. Anything with meaningful equity beta caught the bounce.
Munis and rate-sensitive credit lagged. National Municipal -0.72%, NY Muni -0.10%, CA Muni -0.42%, Investment Grade Bond -0.02%. Senior Loans -1.09%, MLPs -0.82%, Commodities -1.74%. The categories that led last week (when MLPs were up nearly 5%) gave back ground.
ASA continued to fall. The single worst-performing BUY-rated name was ASA Gold and Precious Metals at -8.03%, extending a multi-week slide in the precious metals complex. By contrast, KF (Korea Fund), AEF (Aberdeen EM), PEO and BGR all stabilized or bounced after last week’s losses. The metals trade is the lone hold-out from last week’s mean-reversion theme.
Universe NAV +0.18%, price +0.31%. Roughly 13 bps of the weekly price move came from discount tightening rather than NAV growth, modestly favorable for income investors holding through the cycle.
What the CEF Data Is Telling Us
BUY discounts barely moved (-4 bps); WATCH and SELL discounts widened sharply. Average discount on the 98 BUY-rated funds stayed essentially flat. WATCH widened by 237 bps and SELL widened by 283 bps. The market is paying up to own quality and demanding more discount to hold the weak names. That separation is the model’s edge made visible in the discount data.
Stability rebounded from rotation extreme. Last week’s 98.9% BUY stability showed the model digging in during a down tape. This week’s 95.9% shows it sticking with conviction while taking the bounce. HOLD stability hit 98.7%. The 4 BUY-to-not-BUY rotations this week are normal week-to-week churn, not a regime change.
No new fund crossed into REDUCE_EXIT. Last week’s three (FCO, GRX, IGR) remain the flagged names from the most recent complete deterioration scan. No fresh structural-distribution risks emerged in the week’s price action.
Top BUY Winners and Why
STK +8.00% Columbia Seligman Premium Technology Growth, tech-equity covered-call.
IGD +4.83% Voya Global Equity Dividend & Premium Opportunity.
BTX +3.73% BlackRock Health Sciences Term Trust, second straight strong week.
TWN +3.46% Taiwan Fund, recovered after last week’s softness.
BTO +3.24% John Hancock Financial Opportunities.
The pattern: tech-flavored equity income and broad equity-dividend names led. Categories that lagged last week (Tech and Financials within Sector and US Equity) bounced.
Where BUY Trailed
ASA -8.03% ASA Gold and Precious Metals, continued decline.
BPRE -4.11% Brookfield Real Assets Income.
SPPP -3.44% Sprott Physical Platinum and Palladium Trust.
FXBY -3.33% FT Energy Income Partners Strategy.
HQL -3.32% Tekla Life Sciences, reversed last week’s healthcare rally.
Two precious-metals names (ASA, SPPP) and one energy specialty fund (FXBY) anchored the bottom. The metals trade still hasn’t found a floor. If ASA stays in BUY territory another week without bouncing, the system will eventually rotate the signal; for now the model is holding.
Signal Stability
BUY 95.9% (94 of 98), HOLD 98.7% (225 of 228), WATCH 68.8%, AVOID 72.7%, SELL 88.9%. The middle of the ladder (WATCH and AVOID) saw the most rotation, which is exactly where rotation should happen.
Portfolio Health
Deterioration monitoring (last complete scan May 12; no new scan completed this week):
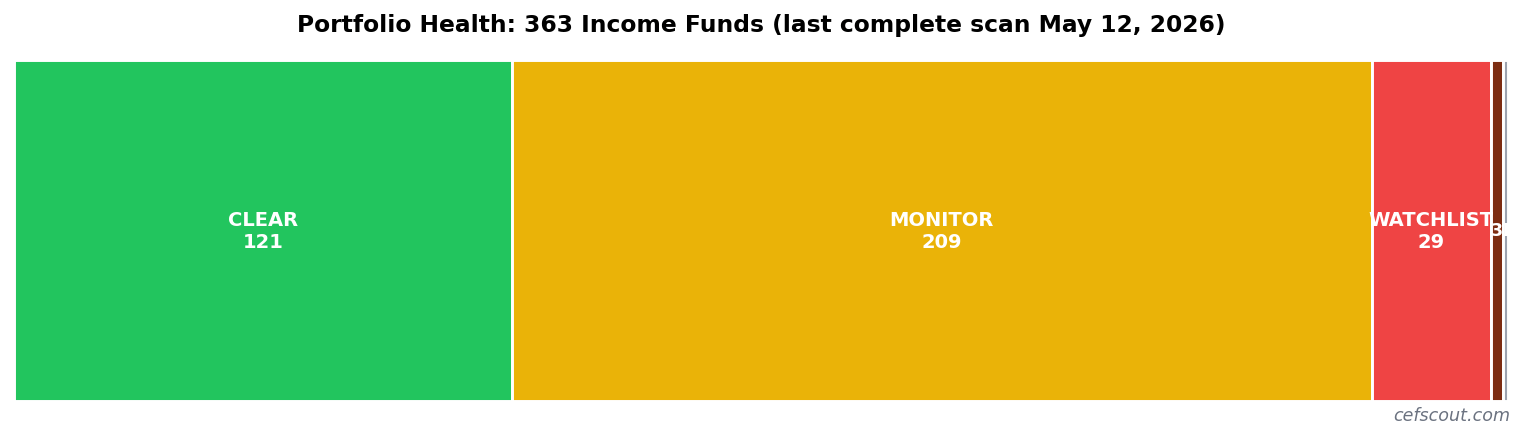
CLEAR: 121 funds
MONITOR: 209 funds
WATCHLIST: 29 funds
REDUCE_EXIT: 3 funds (FCO, GRX, IGR)
INSUFFICIENT_DATA: 1 fund
The May 15 deterioration scan did not complete in time for this publication, so the chart above reflects the May 12 snapshot. The three REDUCE_EXIT names are unchanged from last week. Next scorecard will include a fresh scan.
Six Weeks In
Apr 10 to Apr 17: BUY +2.89% vs Universe +1.81% = +1.07 pts alpha (hit rate 88.0%)
Apr 17 to Apr 24: BUY +0.02% vs Universe -0.49% = +0.51 pts alpha (hit rate 33.8%)
Apr 24 to May 1: BUY +1.10% vs Universe +0.95% = +0.15 pts alpha (hit rate 78.8%)
May 1 to May 8: BUY +1.19% vs Universe +0.94% = +0.24 pts alpha (hit rate 69.1%)
May 8 to May 15: BUY -1.27% vs Universe -1.30% = +0.03 pts alpha (hit rate 26.1%)
May 15 to May 22: BUY +0.57% vs Universe +0.31% = +0.26 pts alpha (hit rate 65.3%)
Sum: +2.26 pts alpha over six weeks. Average: +0.38 pts/week. Six weeks, six positive alpha numbers. Two of the six were down-tape weeks (BUY still positive on relative basis). Four were up-tape weeks (BUY outperformed). No negative-alpha weeks under any condition observed so far.
What to Watch Next Week
This is observation, not prediction.
Metals divergence. ASA, SPPP, and a handful of other precious-metals names continued to slide while the equity bounce played out elsewhere. If the metals trade finds a floor next week, the system’s continued BUY signal on those names is vindicated. If they extend losses, expect signal rotation by the next scorecard.
Muni follow-through. Municipal categories softened for a second straight week. If the trend continues, the rate-sensitive bucket will pull HOLD signals down toward WATCH. Income investors heavy in tax-exempt CEFs should watch their position-level discounts; widening discounts in a soft tape often presage signal rotation.
Equity income leadership persistence. Covered-Call Funds and Sector Equity both posted +2% category averages. Two strong weeks in a row in those buckets would solidify the rotation into equity-flavored income; a give-back next week brings the question of whether this week was a bounce or a turn.
Distribution timing. Most CEFs go ex-dividend in the first week of the month. The next scorecard window (May 22 to May 29) overlaps month-end, so total-return numbers in the May 29 scorecard will reflect a heavier distribution component than this week’s mid-month-light reading.
What This Means for Income Investors
Six weeks of positive alpha across two down weeks and four up weeks is the core claim being made by this scorecard series. The point is not that the system predicts the market; it is that the system behaves consistently across different market conditions. In up weeks BUY leads the universe. In down weeks BUY falls less than the universe. Either way the alpha number is positive.
Average +0.38 pts/week sustained over six weeks compounds. The hit-rate volatility (88% to 26% to 65% across recent weeks) is noise; the stability number (95-99% week over week) is signal. The system is doing its job and the cash distributions arriving in your account every month are the income half of the income-plus-capital-preservation thesis showing up.
Bottom Line
Recovery week. BUY +0.57% vs Universe +0.31% = +0.26 pts. Six weeks in, the alpha tally is +2.26 pts cumulative, +0.38 pts per week average, zero negative weeks. The system is doing what it was built to do across every condition observed since the scorecard began.
Subscribe free to follow along. A new scorecard drops every weekend.
Returns shown are 7-day total returns (price change plus ex-dividend distributions inside the window, matched by ex-dividend date). Signal categories are BUY, HOLD, WATCH, AVOID, SELL. Deterioration alert levels are CLEAR, MONITOR, WATCHLIST, REDUCE_EXIT.
Past performance is not investment advice. CEF Scout publishes systematic income-investing research and does not provide individualized investment recommendations.