Week of May 1 to May 8: Income Signal Scorecard
First scorecard with total returns. BUY signals beat the universe by +0.24 pts. Asia and emerging markets ripped; MLPs got hit.

This one is a few days late. We rebuilt the data pipeline so distributions and historical prices now stream into the scrape loop, which means scorecards from here forward report total returns (price change plus ex-dividend distributions) instead of price-only. The methodology footnote at the bottom spells it out.
The Numbers
Week of May 1 to May 8, 2026. Universe: 363 funds.
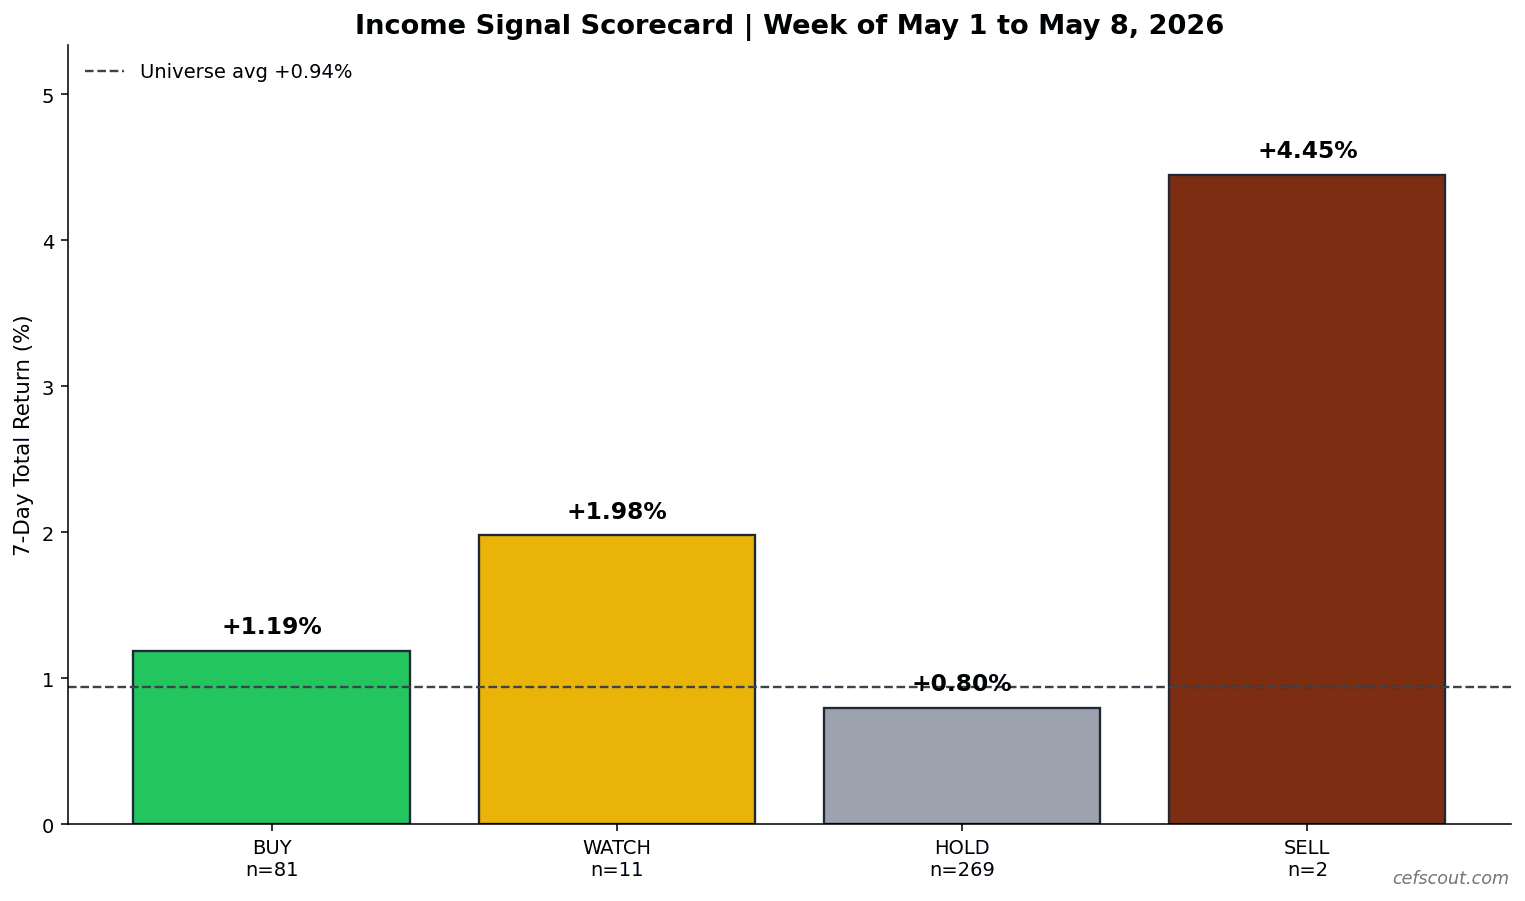
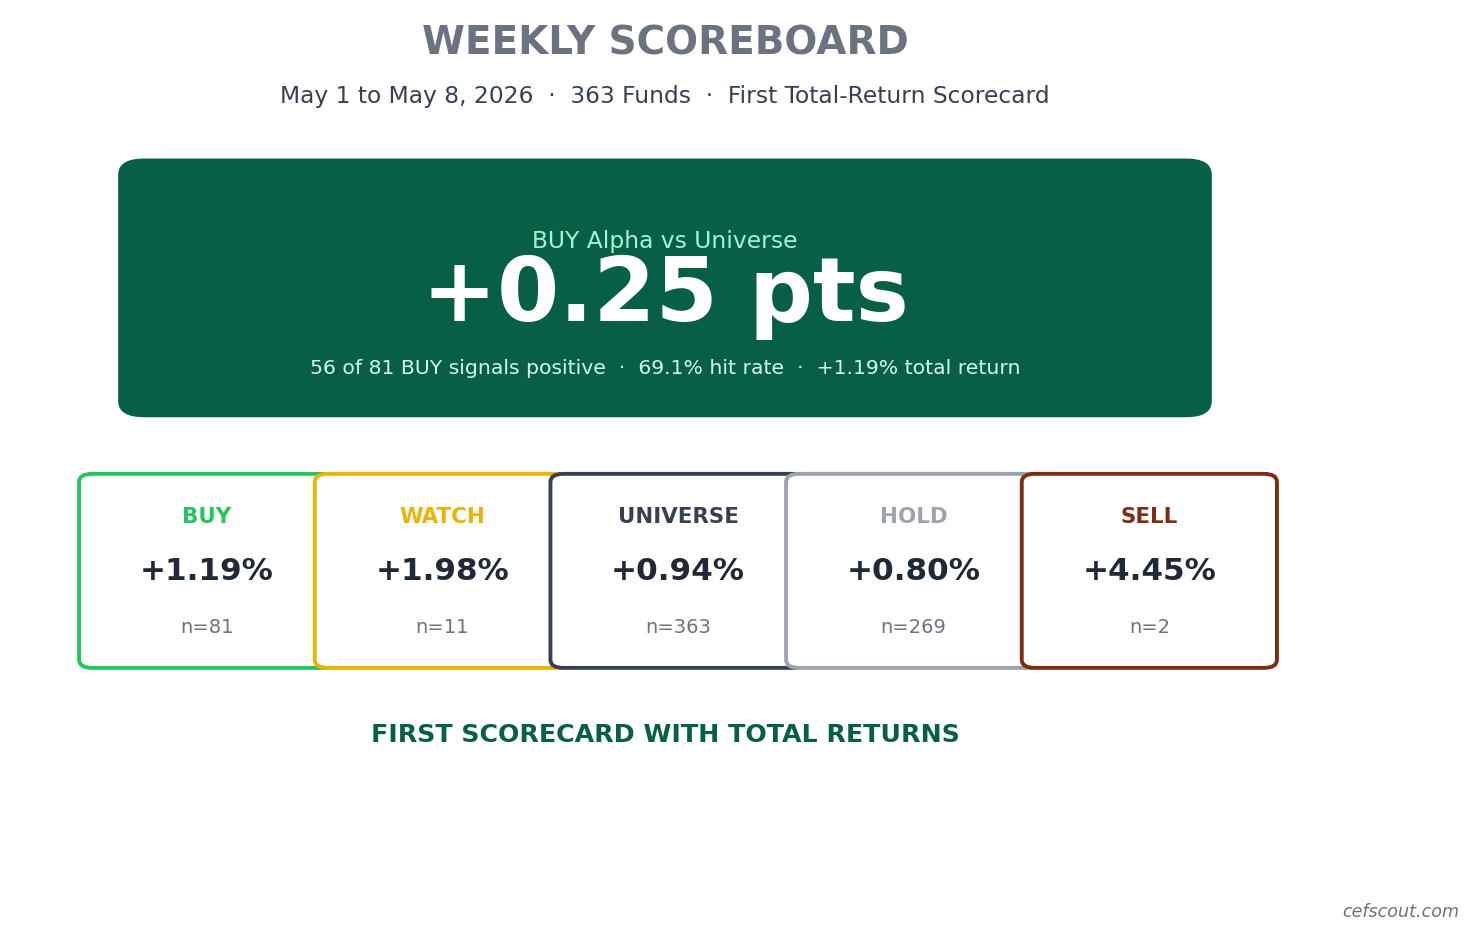
BUY: +1.19% (n=81, hit rate 69.1%)
WATCH: +1.98% (n=11)
HOLD: +0.80% (n=269)
SELL: +4.45% (n=2, noise on a tiny sample)
Universe: +0.94% (n=363)
BUY signals beat the universe by +0.24 pts on a total-return basis. 56 of 81 BUY-rated funds finished positive for the week (a 69.1% hit rate). BUY total return was +1.19% vs universe +0.94%.
What the Market Did This Week
Asia and emerging markets ripped. Asian Equity Funds posted +4.67% on 8 names, Emerging Market Equity +6.41% on 3 names, Latin American Equity +2.91% on 2 names. The Korea Fund (KF) led the entire universe at +18.61%. EMF added +9.03%.
Precious metals and commodities kept moving. Commodities Funds averaged +4.00%. PSLV finished +7.29%, CEF +5.05%. These are mostly metal trusts riding a broader move in the underlying.
CLOs and converts had a quiet but solid week. Collateralized Loan Obligations averaged +3.73% (n=9), Convertibles +2.46% (n=10). Both categories tend to lead when credit risk appetite turns up.
Munis held steady. National Municipal averaged +1.64% (n=40), Muni High Yield +1.23% (n=14). Nothing dramatic, but a positive week across the largest single category in the universe.
MLPs got hit. MLP Funds averaged -4.18% on 5 names. Energy Natural Resources, by contrast, finished flat at +0.01%. The data tells us MLP funds dropped while broader energy CEFs did not. The data does not tell us why; possible drivers include distribution timing or specific fund flows rather than a sector-wide energy move.
Credit lagged. High Yield Bond Funds -0.34%, Multisector Bond Funds -0.40%, Loan Participation -0.23%, Global Income -0.49%. Income-heavy credit was the soft spot of the week.
What the CEF Data Is Telling Us
Discounts narrowed on BUY funds. Average discount for BUY-rated funds tightened by 32 bps over the week. WATCH and SELL discounts widened (WATCH +208 bps, SELL +411 bps on n=2). When the system flags a fund BUY and the discount then tightens, price is doing more work than NAV. That is the pattern the model is designed to catch.
Price outran NAV at the universe level. Universe price total return was +0.94%; NAV change was +0.74%. Roughly 20 bps of the weekly move came from discount compression rather than fundamentals. Modest but in the right direction for income investors.
Defensive posture is still the modal stance. 269 of 363 funds (74%) carried HOLD ratings going into the week. The model is not aggressively long the universe; it is selective about where it puts BUY weight.
Top BUY Winners and Why
KF +18.61% Korea Fund, riding the broader Korean equity move.
NMI +9.26% Nuveen Muni Income, outsized on a single-name basis for a muni fund.
EMF +9.03% Templeton Emerging Markets, EM equity tailwind.
PSLV +7.29% Sprott Silver, metal trust.
CEF +5.05% Sprott Physical Gold and Silver, metal trust.
These five drove a meaningful share of the BUY bucket’s outperformance. The pattern is consistent: international equity exposure plus precious metals.
Where BUY Trailed
CFND -7.20% small fund, name-specific move.
PEO -5.84% Adams Natural Resources, energy weakness on this name despite Energy NatRes finishing flat as a category.
BGR -5.61% BlackRock Energy and Resources Trust, similar story.
Two of the three are energy names where the broader category was flat, which is a tell that these are fund-specific moves, not a sector call going wrong.
Signal Stability
70.4% of BUY-rated funds held their BUY rating week over week (57 of 81). HOLD held at 74.7%. This is below the 90% target for a normal week. The Timing model rotated more than usual this week, which is consistent with the kind of category divergence we saw (EM and Asia up, credit and MLP down).
Portfolio Health
Deterioration monitoring as of May 8:
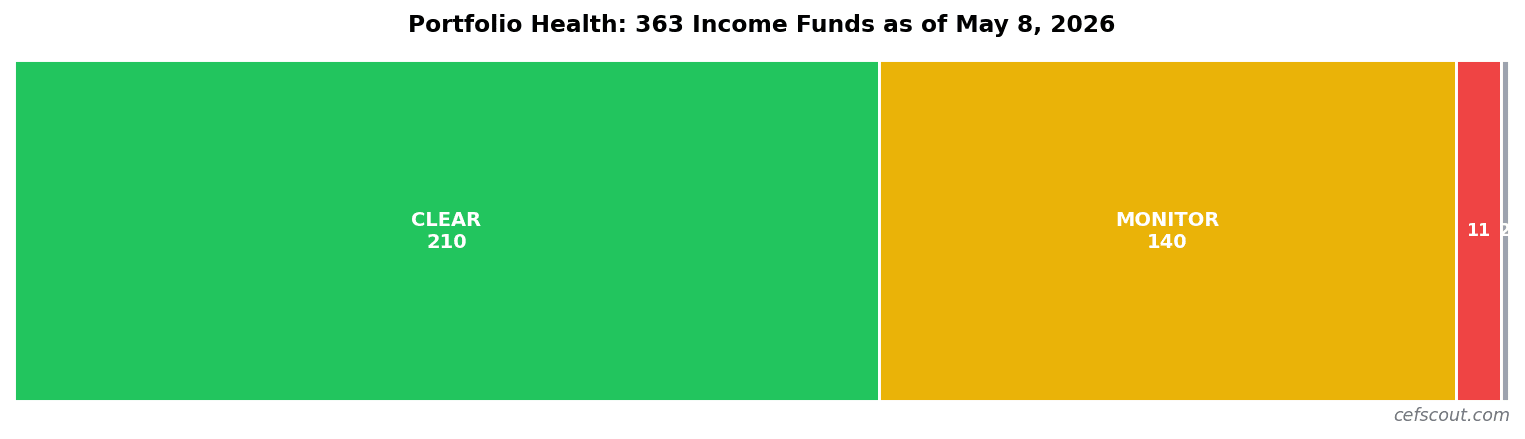
CLEAR: 210 funds
MONITOR: 140 funds
WATCHLIST: 11 funds
INSUFFICIENT_DATA: 2 funds
No funds hit REDUCE_EXIT this week. The 11 WATCHLIST names are flagged for elevated risk on coverage, ROC, or leverage spread, but none crossed into exit territory.
Four Weeks In
Apr 10 to Apr 17: BUY +2.89% vs Universe +1.81% = +1.07 pts alpha (hit rate 88.0%, n=117)
Apr 17 to Apr 24: BUY +0.02% vs Universe -0.49% = +0.51 pts alpha (hit rate 33.8%, n=80)
Apr 24 to May 1: BUY +1.10% vs Universe +0.95% = +0.15 pts alpha (hit rate 78.8%, n=80)
May 1 to May 8: BUY +1.19% vs Universe +0.94% = +0.24 pts alpha (hit rate 69.1%, n=81)
Sum: +1.97 pts alpha over four weeks. Average: +0.49 pts/week. Four weeks, four positive alpha numbers. The Apr 17 to Apr 24 row is the honest one: a 33.8% hit rate while still squeezing out +0.51 pts of alpha because BUY funds fell less than the universe. That is a week when capital preservation showed up before total return did.
What to Watch Next Week
This is observation, not prediction.
Discount compression on BUY funds. 32 bps of tightening in a single week is meaningful. If that continues, the BUY bucket carries a tailwind into the following week. If it reverses, the prior week’s outperformance gives back some ground.
EM and Asia leadership. The funds that drove the BUY bucket this week were international equity and metals. Those moves rarely persist for 4 to 6 weeks in a row without a pause. The system does not care about the macro story; it will reweight as discounts move.
Credit category weakness. HY Bond, Multisector Bond, Loan Participation, Global Income all finished negative. If that continues, signals in those buckets will rotate from HOLD into WATCH and AVOID. Income investors weighted heavily to credit-driven CEFs are the ones who feel that move first.
Distribution timing. Most CEFs go ex-dividend in the first week of the month. Mid-month windows like May 8 to May 15 typically have lighter distribution flow, which means next week’s total-return numbers will lean more heavily on price action.
What This Means for Income Investors
The income-plus-capital-preservation thesis lived through one more week. BUY funds out-earned the universe on a total-return basis with a 69% hit rate. Discounts tightened where the model said they should. No funds in the universe crossed into exit territory.
A 70% BUY stability rate is lower than we want to see in a normal week, and that means the model is rotating. For an income investor, the takeaway is not “follow every BUY signal” but “if your held positions are still in the BUY or HOLD buckets and their discount is tightening, the system says the thesis still holds.”
Bottom Line
Four weeks of total-return scorecards, four weeks of positive BUY alpha. Average +0.49 pts/week, no negative weeks. This is the income-investing edge we set out to prove: outperform the universe on price plus distributions, with capital preservation as the prerequisite.
Subscribe free to follow along. A new scorecard drops every weekend.
Returns shown are 7-day total returns (price change plus ex-dividend distributions inside the window, matched by ex-dividend date). Signal categories are BUY, HOLD, WATCH, AVOID, SELL. Deterioration alert levels are CLEAR, MONITOR, WATCHLIST, REDUCE_EXIT.
Past performance is not investment advice. CEF Scout publishes systematic income-investing research and does not provide individualized investment recommendations.