Week of Apr 24 to May 1: Income Signal Scorecard
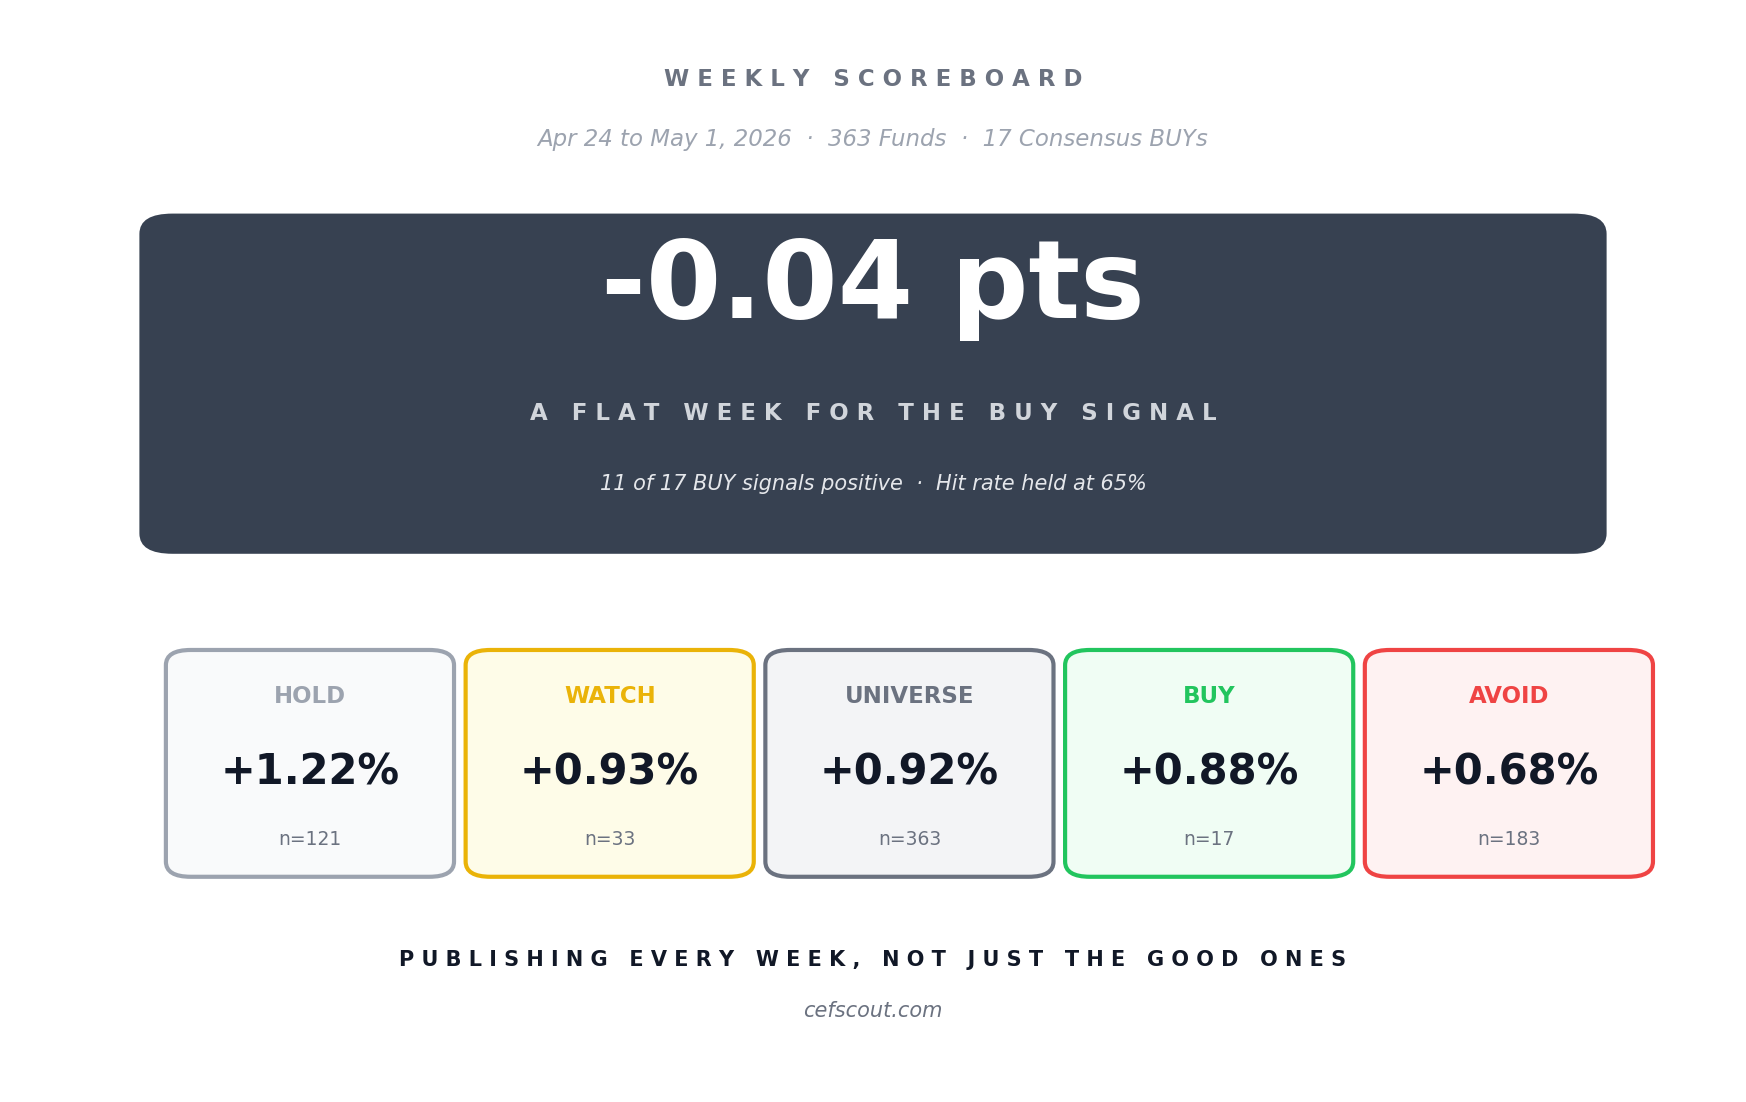
A flat week for the BUY signal.

The system did not generate alpha this week. The 17 Consensus BUY signals returned +0.88%. The universe returned +0.92%. That is -0.04 pts of alpha. Essentially flat, slightly behind.
After two weeks of clean alpha (+1.42 pts, then +0.95 pts), this is the first negative reading. It will not be the last. This scorecard publishes every week, not just the good ones.
The Numbers
Week of Apr 24 to May 1, 2026. Universe: 363 funds (3 funds delisted from the prior universe). Consensus BUYs: 17.
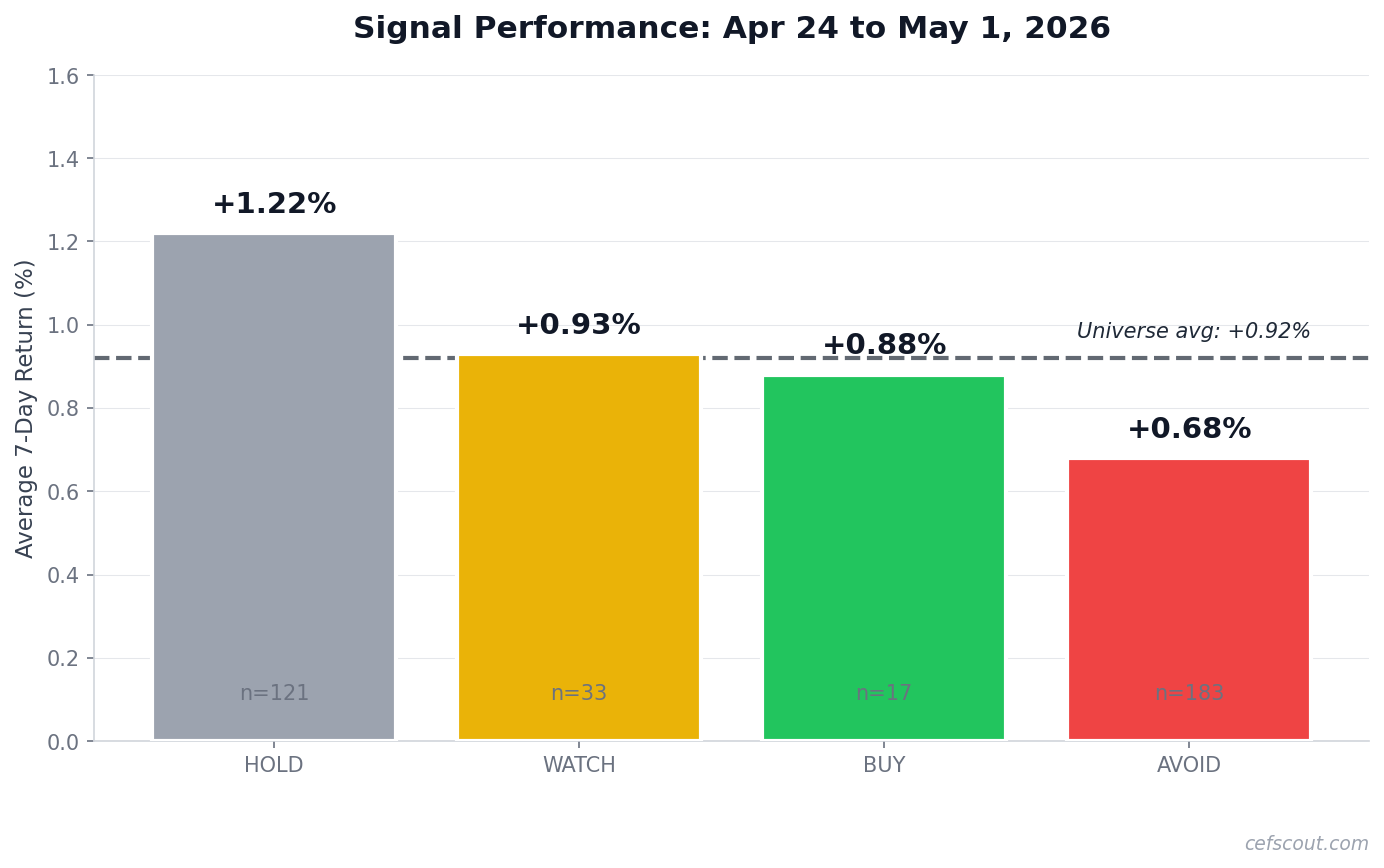
Signal performance breakdown (7-day price-only returns):
HOLD: 121 funds, +1.22%
WATCH: 33 funds, +0.93%
Universe: 363 funds, +0.92%
Consensus BUY: 17 funds, +0.88%
AVOID: 183 funds, +0.68%
SELL: 9 funds, +1.84%
Two things to call out honestly.
First, BUY trailed. The Consensus BUY group lost 0.04 pts to the universe. This was a broad rally (everything was up), and the BUYs participated less than the average fund. Hit rate stayed solid at 65% (11 of 17 positive), so it was not a wipeout, just a flat result.
Second, SELL bounced. The 9 SELL-rated funds returned +1.84%, the highest of any bucket. On a 9-fund sample over one week, that is mean reversion in deeply oversold names rather than a system failure. Small samples in single weeks are noisy.
The discrimination the system maintained: HOLD funds returned +1.22% while AVOID funds returned +0.68%, a 0.54 pt spread between owned-quality and not-owned-junk. That separation is intact even when BUY does not lead.
Signal Stability
12 of 17 Consensus BUY signals held their rating through Friday (71% stability). Five BUYs got downgraded to HOLD. Stability typically tightens after a soft week, which is exactly what happened. Across all 363 funds, 92% held their rating week over week.
Portfolio Health
Deterioration monitoring as of May 1:
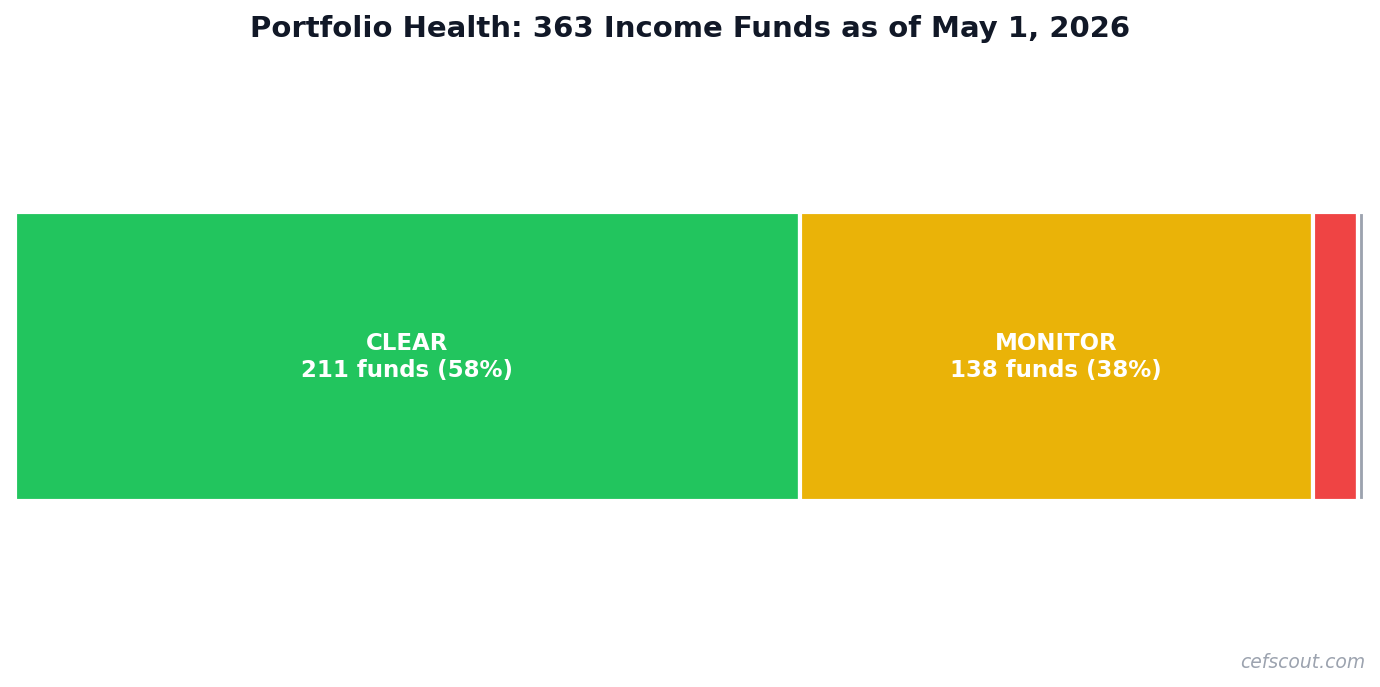
211 funds CLEAR (healthy distributions, stable NAV)
138 funds MONITOR (elevated but not critical)
12 funds WATCHLIST (active deterioration concerns)
2 funds with insufficient data
WATCHLIST count is steady at 12. CLEAR ticked up by one. No new fund failures this week.
Three Weeks In
This is the third weekly scorecard. The running tally:
Apr 10 to Apr 17: +1.42 pts of alpha (up week)
Apr 17 to Apr 24: +0.95 pts of alpha (down week)
Apr 24 to May 1: -0.04 pts of alpha (flat week)
3-week sum: +2.33 pts of alpha
3-week average: +0.78 pts per week
Three weeks is too short to draw conclusions. A hundred weeks is closer to the right sample. The point of publishing every Saturday is to build that record in public, regardless of whether the week is flattering.
What This Means for Income Investors
A systematic income system that produces alpha every single week does not exist. Anyone selling you that is either lying or drawing on too short a sample. What a real system does is produce alpha on average over time, while telling you honestly what happened each week.
This week the system was flat. Subscribers got the data, the methodology, and the longer view. That is the deal.
Bottom Line
Publishing the bad weeks is the entire point. If the running record is honest, the eventual numbers are believable. If it is curated to only show wins, the numbers mean nothing.
Subscribe free to follow along. A new scorecard drops every weekend, including this one.
Methodology: Returns shown are 7-day price-only returns and do not include distributions paid during the window. Consensus BUYs require all three signal layers (Timing, Academic, Health) to agree on BUY. Distribution-adjusted total returns will be added in a future release.
Disclaimer: Past performance is not indicative of future results. This is not investment advice. Signals are generated by a systematic model and are presented for educational purposes only. Margin amplifies gains and losses.