How I “Lost” Only 4.91% When Everyone Else’s Income Dried Up
How a systematic income strategy kept cash flowing through the worst bond market in a generation, and came out ahead

2022 was the worst year for income investing in 40 years. Bond funds, leveraged income funds, high-yield closed-end funds got crushed. Distributions were cut. NAV collapsed across the sector. My systematic approach showed a paper loss of 4.91%.
But here is the part most people miss: not a single dollar was actually lost.
What 2022 Did to Income Investors
Rising rates did something brutal to income funds. Their portfolios fell in value as bond prices dropped. Then, for leveraged funds, the borrowing costs spiked at the same time. They were getting hit from both sides. The income that investors were counting on started getting cut. The average income-focused fund dropped 20-25% that year. The S&P 500 dropped 18%. People who thought they were in safe, conservative income funds lost more than the stock market.
This is the trap that income investing sets for people who are not paying attention. High yield looks safe. Monthly distributions feel reliable. Until they are not.
The Income Kept Flowing
While the paper value of my portfolio dipped 4.91%, the actual cash distributions never stopped. The portfolio yielded 5.7% in 2022 on actual cash paid out. Not promised, not projected, paid. All while the Federal Funds Rate rose from 0.25% to 4.5%. The income stream that the strategy is built around held up through the worst income investing environment in a generation.
That distinction matters. TWRR (Time-Weighted Rate of Return, a standard measure of portfolio price performance) measures price movement. It does not measure cash in your pocket. A mark-to-market loss in a year where your income keeps flowing is a very different thing from a real loss.
Paper Loss vs. Real Loss
Here is what the full accounting shows across the life of this portfolio. Total capital deployed across all purchases and total capital returned through sales and distributions tells the complete story. When you add up every dollar that went in and every dollar that came back out, including all distributions paid and all sale proceeds received, the capital returned exceeds the capital deployed. The current portfolio still holds active positions worth real value on top of that.
Every dollar is accounted for. Still in positions, returned as distributions, or returned as sale proceeds. The -4.91% in 2022 was a mark-to-market number. No capital was destroyed.
As of today, the equity value of the portfolio is pure profit. Not a single dollar of my own capital is invested. Every dollar, I personally put in has been withdrawn. Current Annualized yield on ‘invested’ capital is 9.3%, while the portfolio is showing a YTD 4.1% gain.
Why the System Survived It
The automated deterioration monitoring flagged funds showing stress before the worst damage hit. When leverage spreads compressed, when distribution coverage ratios deteriorated, when NAV trends reversed, the system signaled exits. Not perfectly. But early enough to limit exposure before the deepest losses in the sector.
More importantly, the capital that was protected in 2022 was available to redeploy when everything was cheap in late 2022 and early 2023. That positioning is what generated the recoveries that followed. You cannot capture a recovery if you do not have capital left to deploy.
Why 2022 Matters More Than Any Other Year
Here is the full picture:
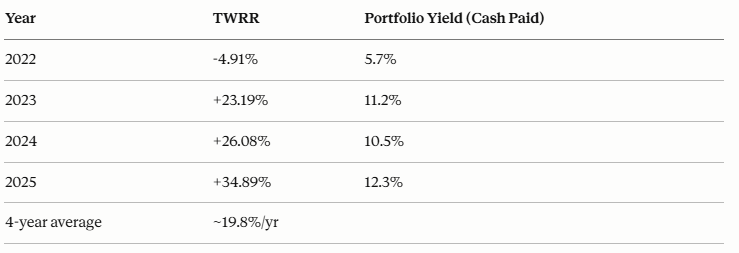
Anyone can make money in a bull market. The question is what happens when the market tries to take it back. In 2022, the income kept flowing at 5.7% yield while the paper value dipped. In 2023, when the recovery came, the portfolio was fully positioned to capture it: +23.19% TWRR plus an 11.2% cash yield on top. The 4-year average of ~19.8% annual return runs through the worst income investing environment in a generation. That is the number that matters. The 2025 figure of +34.89% reflects the full redeployment of protected capital into the recovery, a direct result of not being washed out in 2022.
The Lesson
Capital preservation is not the opposite of income generation. It is the prerequisite.
If your capital is intact in the bad years, it compounds in the good ones. If it is not, you spend the recovery years just getting back to where you started. The funds that chased the highest yield in 2021 were the ones that cut distributions in 2022. The ones that looked boring, with lower yield, stronger coverage, and disciplined leverage, kept paying through the crisis.
Systematic evaluation separates the income generators from the yield traps. The yield number on a screener is the last thing to look at. Coverage, NAV trend, leverage spread: those tell you whether the income is real and whether the capital behind it is safe.
The goal is never the yield number. The goal is income that keeps coming, from capital that keeps growing.
What This Newsletter Covers
CEF Scout monitors 366 closed-end funds daily using an automated system that flags deterioration before the damage compounds. Every week: income market commentary grounded in data. Every month: the Signal Scorecard: how the system’s signals performed across the full fund universe. No stock tips. No generic buy/sell recommendations. Just a rigorous, systematic lens on where the income is real and where it isn’t.
Subscribe free. See the monthly Signal Scorecard.
Past performance does not guarantee future results. TWRR is calculated by Interactive Brokers and strips out deposits and withdrawals to show pure strategy return. Strategy uses margin which amplifies both gains and losses. This is not investment advice. Individual results vary by entry point, position sizing, and fund selection.